Introduction
Rheology is the science of flow and
deformation
of matter and describes the interrelation between force, deformation
and
time. The term comes from Greek rheos meaning to flow. Rheology is
applicable
to all materials, from gases to solids.
The science of rheology is only about
70 years of age. It was founded by two scientists meeting in the late
'20s
and finding out having the same need for describing fluid flow
properties.
The scientists were Professor Marcus Reiner and Professor Eugene
Bingham.
The Greek philosopher Heraclitus described
rheology as panta rei - everything flows. Translated into rheological
terms
by Marcus Reiner this means everything will flow if you just wait long
enough.
Fluid rheology is used to describe the
consistency of different products, normally by the two components
viscosity
and elasticity. By viscosity is usually meant resistance to flow or
thickness
and by elasticity usually stickiness or structure.
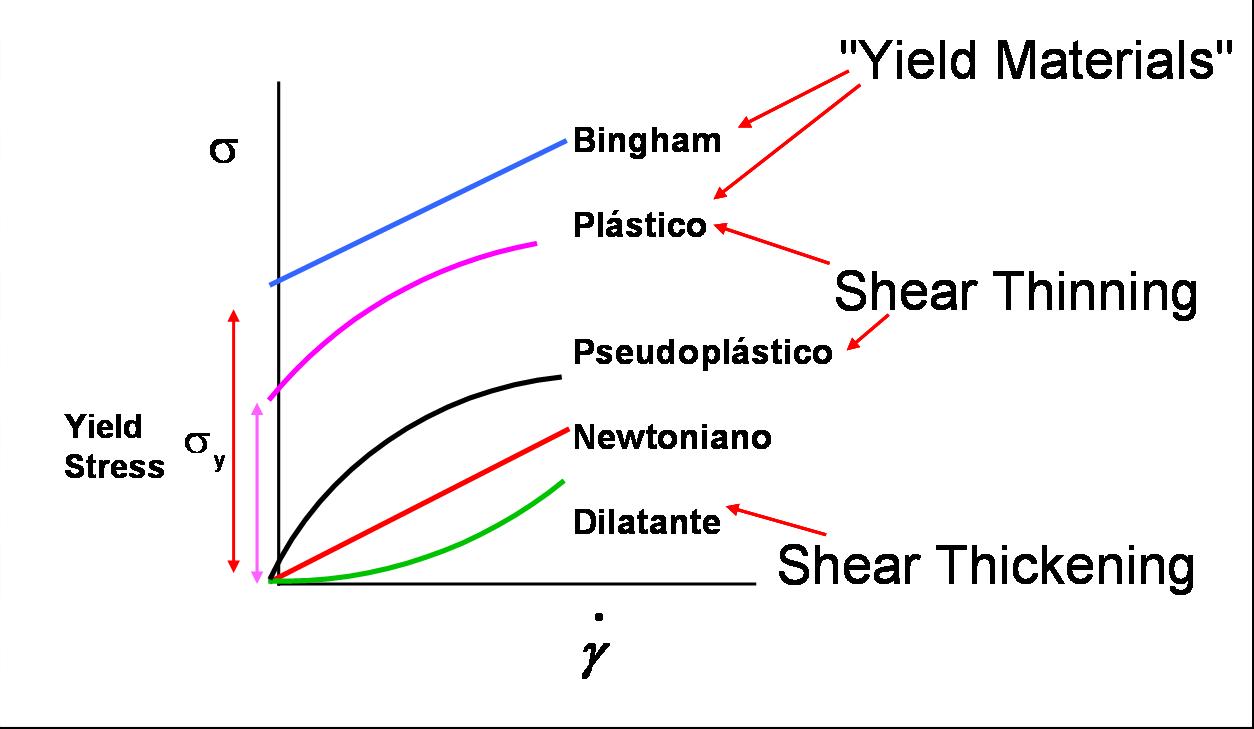
Classification of materials
Fluids are normally divided into three
different groups according to their flow behaviour:
Newtonian fluids
Non-Newtonian fluids, time independent
Non-newtonian fluids, time dependent
Flow curves
Kinematic and dynamic viscosity
Kinematic viscosity is measured with
kinematic
instruments , normally different types of cups which means that the
knowledge
and control of shear rates is limited or non-existent. Therefore
kinematic
viscosity values are of little or no use for design of equipment for
non-Newtonian
fluids.
Dynamic viscosity takes into account the
effect of shear rate and time and is therefore the only type of
viscosity
relevant for non-Newtonian design purposes. Dynamic viscosity is
measured
with dynamic instruments, either rotating (shearing) or oscillating.
An instrument only capable of measuring
shearing viscosities is called a viscometer and the oscillating type is
called a rheometer.
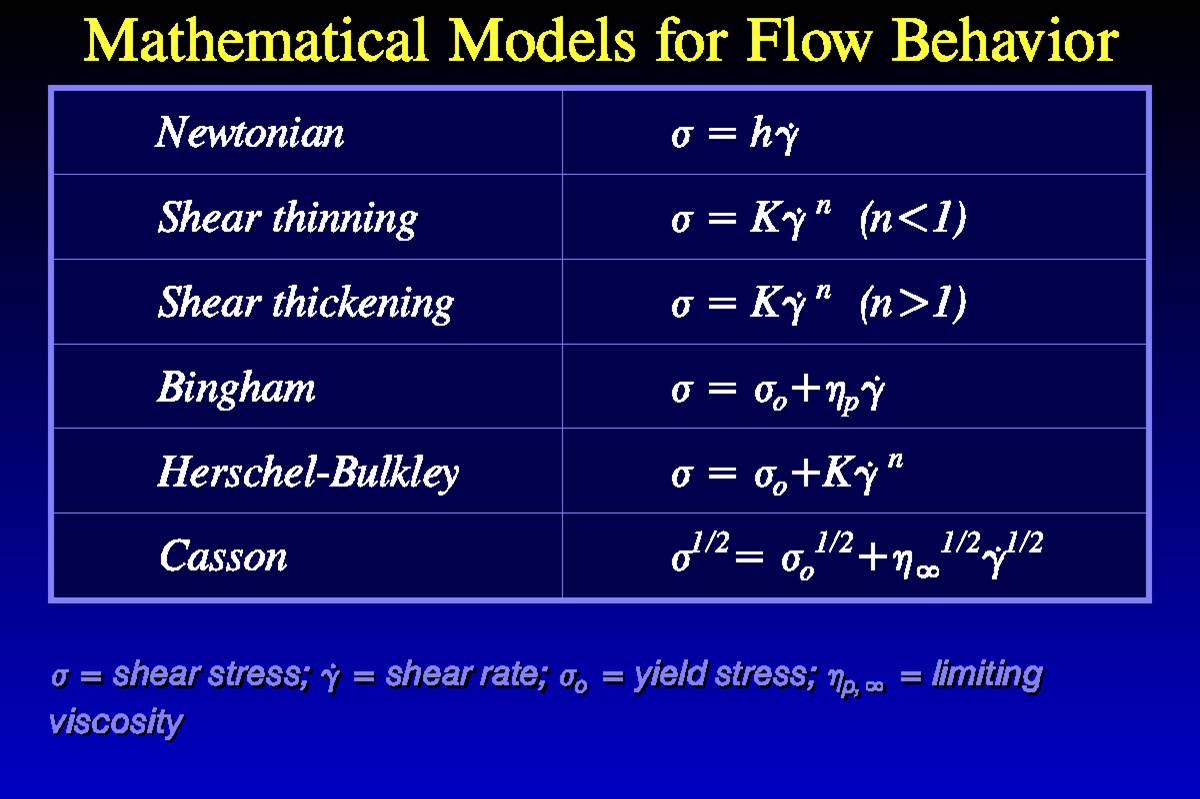
Basic constitutive equations
Various models for approximation of
rheological
data have been presented. One of the most widely spread models is the
so-called
power law for approximation of viscosity data. The main reason for the
power law being so popular is that the shearing rheological behaviour
of
a fluid is represented simply by a straight line in a log-log shear
rate/shear
stress graph. Another reason is that the shearing behaviour of most
fluids
lends itself to a good approximation applying the power law.
Viscoelasticity
All materials, from gases to solids,
can
be divided into the following three categories of rheological behaviour:
Viscous materials: in a purely viscous
material all energy added is dissipated into heat
Elastic materials: in a purely elastic
material all energy added is stored in the material
Viscoelastic materials: a viscoelastic
material exhibits viscous as well as viscoelastic behaviour
Typical examples of viscoelastic
materials
are bread dough, polymer melts and artificial or natural gels.
Note: in the rheological sense water is
a "viscous" fluid. Normally, however, the term "viscous" is used for
fluids
with high viscosity.
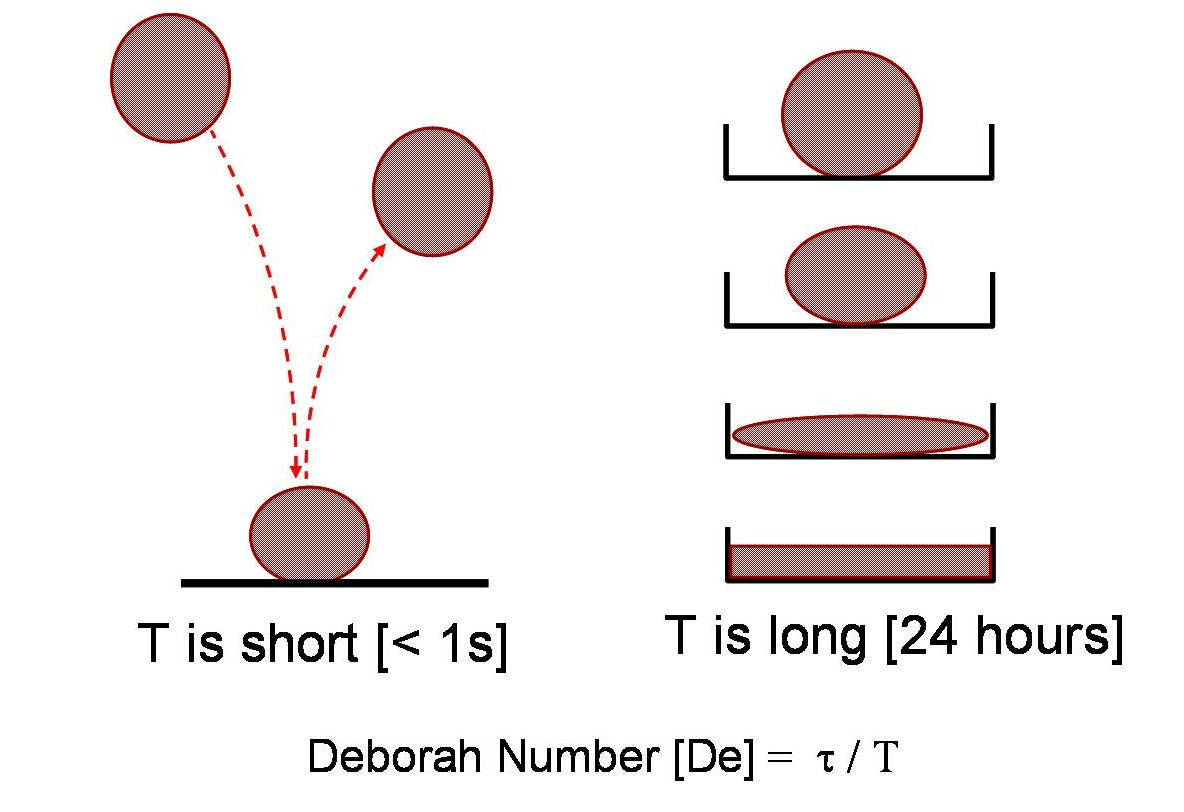
In most cases of viscoelastic behaviour
the time factor has a significant impact on the flow properties
observed.
A measure of the influence of time is the so-called Deborah Number, D:
D = (response time) / (observation time)
An example of a system having a large
Deborah Number is a normal glass window. If old enough, e.g. an old
church
window, a difference in thickness at the top and at the bottom can be
easily
measured. Although the viscosity of glass is high, about 1040 Pas, it
is
still a liquid and consequently it flows. However, the observation time
has to be long, perhaps a couple of centuries, to observe the movement.
When shearing a viscoelastic fluid
so-called
normal stresses will appear. These normal stresses can result in flow
behaviour
quite different from that of Newtonian fluids.
Viscosity and elasticity measurements
Rheological measurements are normally
performed
in kinematic instruments in order to get quantitative results useful
for
design and development of products and process equipment. For design of
products, e.g. in the food, cosmetic or paint industry, rheometric
measurements
are often performed to establish the elastic properties, such as gel
strength
and yield value, both important parameters affecting e.g. particle
carrying
ability and spreadability. For design of process equipment the
properties
during shearing of the product is of prime interest. Those properties
are
established in a normal viscosity measurement.
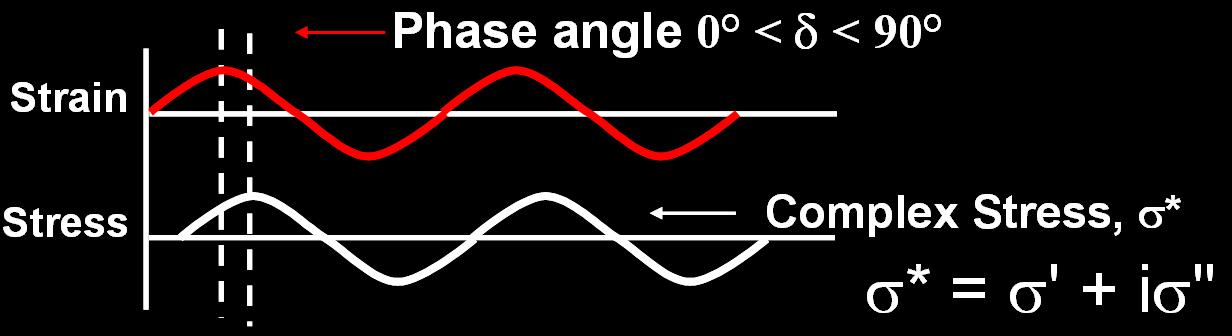
A rheometric measurement normally consists
of a strain (deformation) or a stress analysis at a constant frequency
(normally 1 Hz) combined with a frequency analysis, e.g. between 0.1
and
100 Hz. The strain sweep gives information of the elastic modulus G',
the
viscous modulus G'' and the phase angle d. A large value of G ' in
comparison
of G '' indicates pronounced elastic (gel) properties of the product
being
analysed. For such a product the phase angle is also small, e.g.
20º
(a phase angle of 0º means a perfectly elastic material and a
phase
angle of 90º means a perfectly viscous material). The frequency
sweep
gives information about the gel strength where a large slope of the G '
curve indicates low strength and a small slope indicates high strength.
A viscometric measurement normally
consists
of a shear rate analysis. The shear rate sweep should preferably cover
the range applied in the intended equipment. For liquid foods a shear
rate
range from around 1 to 1,000 s-1 covers the needs for a low-viscous
product,
e.g. milk or juice, and a shear rate range from around 1 to 100s-1
covers
the needs for a high-viscous product, e.g. tomato paste or quark.
Below a number of examples from
measurements
on some fermented dairy products are found. The fermented cream has a
fat
content of about 35%, the fermented milk "type 1" has a fat content of
0.5% and the fermented milk "type 2" has a fat content of 1.5%. Note
that
despite the difference in the elastic modulus G ' between the two
fermented
milk types being significant, the viscosity curves are nearly
identical.
The practical implication of this is that when the two products are
sitting
in a cup the "type 2" fermented milk seems to have appreciably higher
viscosity
than the "type 1" milk, but when subjected to shear, e.g. when being
pumped
through a pipe, the pressure drop will be much the same for both
products.
What is observed in the "cup analysis" is instead the more pronounced
elastic
properties of the "type 2" milk giving the impression of a higher
viscosity.
For the youghurt a significant degree
of thixotropy can be seen in that the "up curve", i.e. the curve
obtained
when increasing the shear rate from zero and upwards, is appearing
above
the "down curve", i.e. the curve obtained when going back in shear rate
to zero. For comparison of the degree of thixotropic behaviour the
distance
or area between the two curves can be calculated, applied to either the
shear stress curves or the apparent viscosity curves.
Read more at the rheology page by Prof
Ulf Bolmstedt
| Back |