CurTiPot= pH calculation + virtual titration
|
||||||||||||||||||||
|
|
CurTiPot
4.4.0 * |
|
|
Full program
+ first steps for beginners ** |
||
|
Full
program
|
||
|
Zipped
full program |
||
|
* Requirements: Microsoft ExcelTM
any version from ** Overlaid
step-by-step instructions in balloons (bubble
text) Vintage .xls versions for ExcelTM 8
to 11 (1997 to 2003) |
||
CurTiPot is
widely disseminated in universities, companies, etc.
(>200,000 copies; >100 countries); frequently used and
cited
in >300 papers
and thesis indexed in Google Scholar.
In a survey of 21 free buffer
calculators and Apps,
the use of CurTiPot
was encouraged over all other
for rigorous pH calculation with confidence
Lucy, C. L., J. Chem. Educ. 2023, 100, 2418?2422
https://doi.org/10.1021/acs.jchemed.2c01203
You may cite CurTiPot as
follows:
Gutz, I. G. R., CurTiPot – pH and Acid–Base
Titration Curves:
Analysis and Simulation freeware, version 4.4.0
https://www.iq.usp.br/gutz/Curtipot_.html
What's inside CurTiPot?
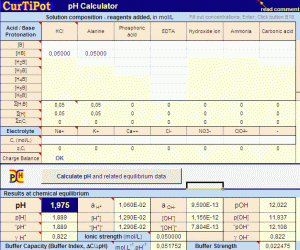
A pH calculator
» "one click" fast pH calculation of any aqueous solution of acids, bases and salts, including buffers, zwitterionic amino acids, from single component to complex mixtures (30 or more species in equilibrium);
» pH , p[H] and "pH" values iteratively computed with an accurate general equation (instead of the aproximate Henderson-Hasselbalch equation) combined with activity coefficients estimation by the Davies equation;
» provides buffer capacity (buffer index, buffer strength), ionic strength, fractional distribution, medium charge of HiB – to find the Isoelectric Point of amino acids –, activities and apparent dissociation constants of all species at equilibrium;
» all relevant data and results can be saved for further use.
» batch processing is available to automate pH calculation of long lists of solutions of variable composition.
Two Titration Data Analyzers
Treat your pH vs. volume input data – real or simulated – in the usual fashion with the Evaluation option or by an advanced Regression method;
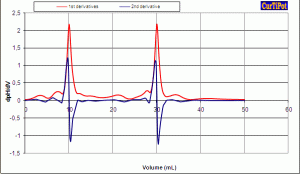
» the Evaluation program finds the inflection point(s) (also known as end points or equivalence points) on a titration curve automatically with enhanced accuracy thanks to cubic splines smoothing and interpolation;
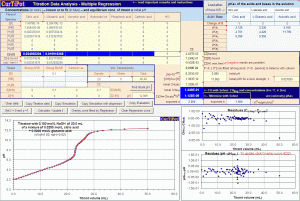
» the Regression spreadsheet assists the modeling of titrarion curves for the determination of concentrations of acids, salts and bases in the sample and the refinement of pKa values by least squares nonlinear regression – essential for titrations of very diluted and/or complex samples that generate curves with ill-ndefined inflections, eg., acid rain. This advanced feature takes into account the effects of ionic strength and activity coefficients.
» results of the data treatment of relevant titrations can be saved for further use.
Two Virtual Titrators
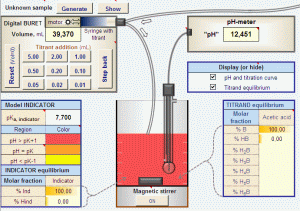
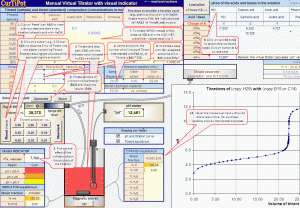
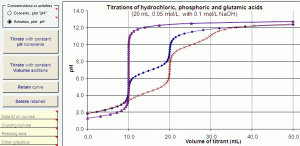
» Titration module for beginners with clickable digital burette, color transition of the chosen indicator for visual endpoint detection and generation of samples with random unknown concentration;
» simulation of pH vs. volume titration curves of any aqueous solution of acids, bases and mixtures;
» simulation of "near real" data tables and plots with random errors (Gaussian distribution) in pH and/or volume, to test data analysis procedures;
» user selectable increments of pH, volume, pH or "pH" plot and titration speed;
» overlay of up to 13 curves for visual comparison of the effect of changes in parameters;
» overlay of real and simulated curves for manual fitting by playing with the parameters;
» unlimited generation of different titration curves for drilling exercises and students' examinations.
A Distribution Diagram Generator
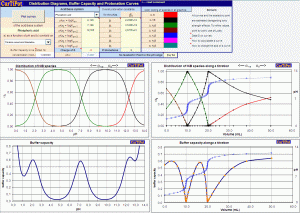
» composition diagrams (alpha plots, distribution curves or molar fraction curves) and buffer capacity curves of any mono or multiprotic acid or base showing the fractional contribution of each protonated and unprotonated species in equilibrium;
» distribution curves plotted against volume of titrant, with overlaid titration curve, revealing the principal species at the inflections (endpoints) and the contribution of each species at any stage of the titration;
» protonation curves an average charge curves of acids or bases showing the average number of protons bound to the Brönsted-Lowry (or Lewis) base – and their weighted charges – as a function of pH as well as volume of titrant (with overlaid titration curve); a zero-crossing of the charge reveals an Isoelectric Point.
A pKa Database
» equilibrium constants of some 250 acids and bases have been compiled into a database expandable by the user.
» quick load of pKa sets of seven acid-base systems into the pH_calc, Titration, Simulation, and Regression modules, for single or simultaneous use.
Configuration and Usage
CurTiPot is released as freeware for personal, educational and non-commercial use; for other applications, contact the author (copyright holder). Download the most recent release of CurTiPot, free of virus, spyware and addware, from this page <www.iq.usp.br/gutz/Curtipot_.html>.
There is no need to install (or uninstall) CurTiPot. Simply run the Microsoft ExcelTM software and open the curtipot_.xlsm file like any other spreadsheet workbook. All preprogrammed equations and Visual Basic embedded macros are self-contained and completely removed when closing CurTiPot (no functions added, no changes made to Excel).
It is necessary to enable macros in Excel to activate the buttons that run the macros for iterative computing of pH, distribution curves generation, smoothing, etc. Follow the instruction given in the Download section or, for older MS Windows versions, read instructions on the front page of CurTiPot, cell AM12 or refer to Microsoft.
All worksheets have embedded instructions and comments, editable/expandable by the user. In addition, the CurTiPot option i version contains balloons (bubble text) with a numbered sequence of first steps to be followed by beginners, like a recipe. Balloons can be deleted as they become superfluous.
The Regression module of CurTiPot uses an Excel supplement named Solver for the determination of concentrations and pKas of acids and bases from titration data by nonlinear least squares regression. If not yet visible in the Excel Data tab, Solver needs to be activated by checking the box in the Excel Supplements list.
Remarks and Assumptions
CurTiPot adheres to the Brönsted and Lowry concept of acids and bases. Solely instantaneous protonation-deprotonation equilibria and effects of ionic strength are computed. No other type of chemical reaction or phase transition is taken in account in the calculations, although they may occur for many combinations of acids and bases (listed or not in the Database).
The pH, usually measured by potentiometry with a cell comprising a glass electrode and a (combined) reference electrode, is strictly defined as -log a[H+] (see definition of pH), where a[H+] is the activity of hydrogen ions, more precisely hydrated protons, H3O+ or hydronium (the simplest type of oxonium ion). At increasing ionic strength, I, ion-ion interactions reduce the activity coefficients (gamma) of all ions including the hydrated protons, H+. The pH_calc, Distribution, Simulation and Regression modules estimate activity coefficients with help of the Davies equation.
The Davies equation gives reasonable estimates up to I ~0.1 mol/L or so (better than the Debye Hückel equation). There are more complete equations applicable at higher I (e.g., Pitzer equation) that take in account individual hydrated ion-size parameters and ion-ion association constants, but these are available only for a limited number of acids and bases in certain electrolytes.
Besides pH, the pH Calculator also displays the p[H] and the "p[H]". Both correspond to -log [H+] with the difference that "p[H]" is computed with thermodynamic constants but ignoring the I effect (like simplistically done in high school), while the constants used in the p[H] calculation (and pH as well) are previously corrected for the I effect (ion-ion interaction) by the Davies equation.
The author provides the freeware on an "as is" basis, with no warranties, expressed or implied, and reserves the right not to be responsible for the correctness, completeness, accuracy and error-free operation of CurTiPot. The author has not introduced any spyware, adware, viruses or malicious code in the program, as checked and assured by many of the distributors of the software (see list).Bug reports and suggestions welcomed by e-mail gutz@iq.usp.br.
Examples and CommentsThe all-in-one modular and interactive design of CurTiPot is user-friendly and lets you rapidly calculate the pH of any aqueous solution, from the simplest to the most complex one. The Virtual Titrator makes the simulation of the titration curve of any acid, base or mixture a breeze; flexibility in the selection of sample size, concentration of ingredients, titration range, type, size and speed of titrant addition and dispersion of the "measurements" give great realism to the process. Quick loading of dissociation constants and one-click data transfer from the Virtual Titrator to both of the data analysis modules - Evaluation and Regression - make it easy to compare a "graphical" or empirical method with the numerical one in a matter of seconds! This is great for learning and teaching as well as for the optimization of new titrations.
Introduce your experimental data pairs of volume of titrant and pH readings from de pH meter (potentiometer with a combined glass electrode or another pH sensor) directly into the spreadsheet of the Evaluation module. Visualize the curve as you enter data point by point during the titration in the laboratory, or afterwards. Select the smoothing factor of the spline that shows the most accurate interpolation of the endpoints (stoichiometric points or equivalence points) on the derivative curves. You will be pleasantly surprised with the effectiveness of spline smoothing for volumetric titration curves with clearly defined inflections and with the power of the Regression module to deal with more difficult data analysis.
Try the Regression module to obtain the best possible estimation of the concentrations (and pKas) of species involved in protonation chemical equilibria. The chemometric approach of multiparametric least-squares nonlinear regression is effective when all relevant pKas fall within (or near outside) the pH range covered by your titration data.
A background in chemometrics, statistics or numerical data analysis is valuable but not essential to profitably explore the power and recognize the limits of the Regression module, in special, for data untreatable by graphical and linearization methods (Gran plot). For example, with Regression, minute concentrations of some acidic and basic components in acid rain samples titrated with strong base can be determined individually or grouped as follows: strong acids (H2SO4 + HNO3), weak carboxylic acid (formic + acetic), bicarbonate (H2CO3/HCO3-/CO3=) and ammonium ion (NH4+/NH3) (FORNARO, A.; GUTZ, I.G.R., Wet deposition and related atmospheric chemistry in the São Paulo metropolis, Brazil. Part 3: Trends in precipitation chemistry during 1983–2003, Atmospheric Environment, 2006, 40(30), 5893-5901).
In principle, CurTiPot can simulate any titration curve in aqueous medium regardless of the number of mixed acid-base systems in equilibrium (within limitations given above). The program is frequently downloaded by users looking for the simulation and evaluation of titration curves of diprotic and triprotic amino acids. We have used CurTiPot, e.g., to simulate and feed pH vs. titrant volume values to a new method of analysis of conductometric titration data (COELHO, L.H.G. and GUTZ, I.G.R., Trace analysis of acids and bases by conductometric titration with multiparametric non-linear regression, Talanta, 2006, 69(1), 204-209).
The program is helpful also for other tasks like determining the amount of acid or base required to neutralize a sample (neutralization), to prepare or displace the pH of a buffer, to change color of a visual indicator, to find the isoelectric point of amino acids, etc. Users in one hundred and thirty countries have found the freeware valuable in their own research as well as to prepare lectures, tutorials, exercises, examination questions, lab guides and experiments, classroom simulations, presentations, papers, etc.
Explore the multiple functions of CurTiPot now
Database of pKas of acids and bases
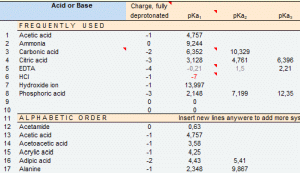
The user-expandable Database reproduces pKas of some 250 monoprotic, diprotic and polyprotic acids and bases selected in larger equilibrium constants databases (references given), including the essential amino acids and ending with some visual indicators.
|
|||
|
Copyright ©1992 - 2026 Features | Download | Screenshots | Installation | Google Scholar Citations | Examples | Database | Remarks | Statistics | Testimonials | Links to Curtipot Sample Screenshots
Database
Visitors are tracked by
Google Analytics >200 thousand
downloads of Videos on CurTiPot (YouTube)
CurTiPot - Playlist in 5 parts 1 - Calibration of electrodes - 2 - pH and conductivity
measurements - 3 - Ascorbic acid titration - 4 - Paracethamol titration - 5 - Potentiometric titration data treatment with CurTiPot - Tratamento de dados de titulação potenciométrica com CurTiPot (20:00) 6 – Conductimetric titration data
treatment with CurTiPot-Cond - Tratamento
de dados de titulação condutométrica com
CurTiPot-Cond* (5:06) |


